
The Transparency Initiative seeks to foster transparency around diversity, equity, and inclusion (DEI) efforts in Portland’s creative industry through surveys, resource hubs, programming, and more. As part of those efforts, they collected data from their inaugural 2022 Survey for Creatives and wanted to compile it into their first report. This report aims to share data that can help foster more equitable and inclusive workplaces where we all thrive. My role on this project was to lead a small volunteer team and create the inaugural report.
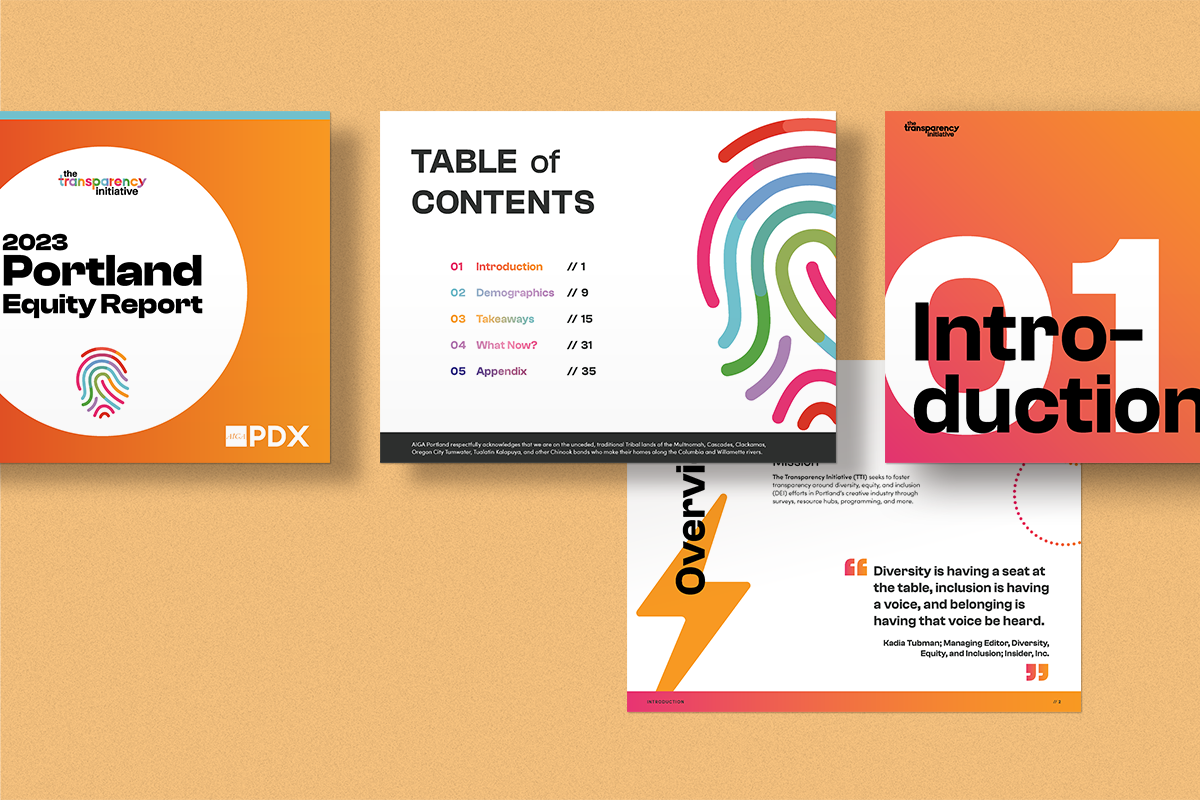
As the project lead, I was responsible for keeping our team on schedule and making sure the report was a comprehensive, clear guide to the results of the survey. Our goal was to rely less on text and focus more on the presentation of data as easily digestible charts and graphs. We utilized select brand colors to differentiate sections and information, and create a visual indicator of where the reader is in the report.
During the three months of this process, I utilized my previous report and data visualization experience to map out our process and guide the development of the report. On a more granular level, I designed the report with charts and graphs for data visualization and an overall layout designed by the team. As we progressed in the design, I coordinated feedback from stakeholders and other volunteers to ensure that we were on the right track.

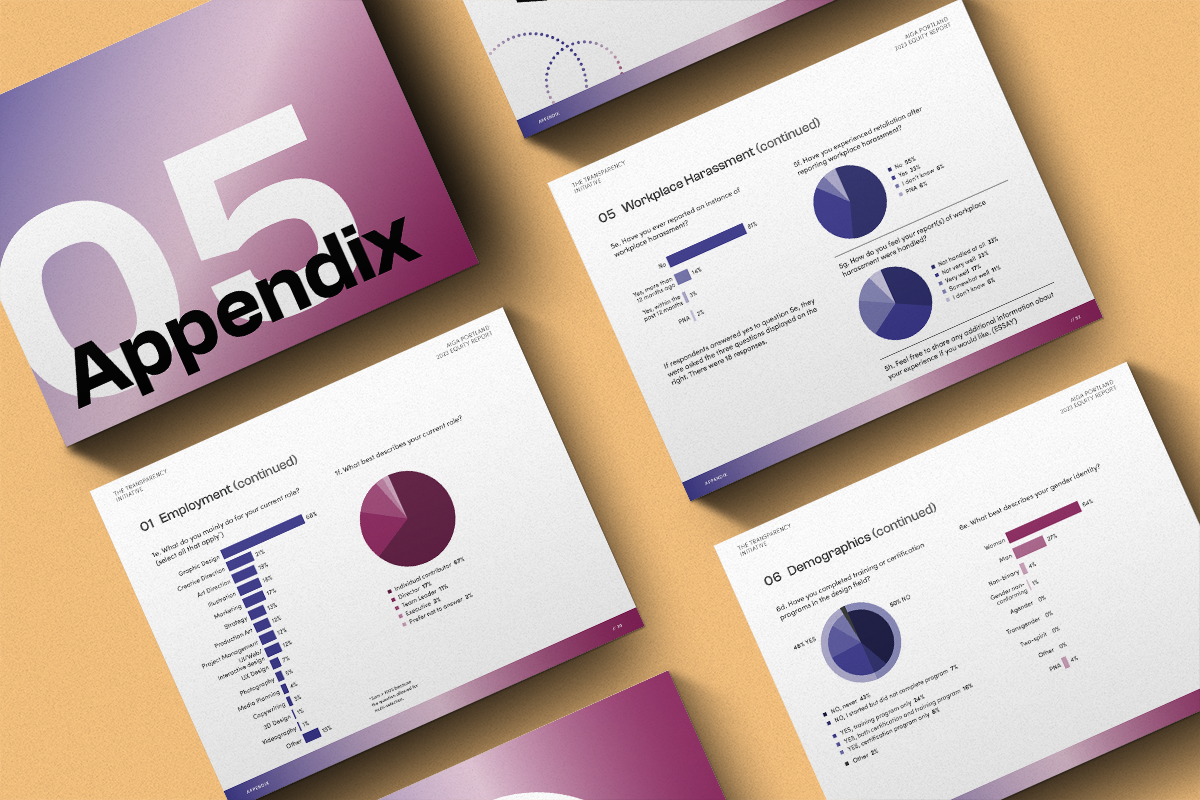
I created the appendix of the report to include all of the survey results in a unified presentation so that readers could dig deeper into survey responses. I created a specific structure to present this information using bar and pie charts with color usage that makes it easy to differentiate between charts and results.
I donated 141+ hours to the creation of this report and I hope it sparks more interest in the work of The Transparency Initiative.
All of the content shown on this project is owned by AIGA Portland.